Arts organizations want to take data from the basic displays that everyone has in their annual reports to something that tells a story, motivates constituents to act, and makes people pay attention. Here are 5 tools to that can help take an organization's reporting to the next level.
Take Our Quiz: The Best Project Management Tool For You and Your Team
Project Management Software is the solution organizations, large and small in all industries, are turning to for organizing resources, people, deliverables, workflow, and projects. In 5 minutes, you just might have a new software-solution for your team. At the very least, you will have a better idea of what you are looking for.
Actual Expense of Visual Arts Education Technology: Infographic
From Strategy to Analysis: A Guide to Navigating Google Analytics
Whether working in digital or traditional channels, quantifying impact and engagement is a challenge. Often, it is difficult to find the causal link between marketing efforts and programmatic success. It can also be confusing to figure out how to effectively use Google Analytics, which, when mastered, can be used as a tool to identify successful communication strategies and observe user behavior.
Our latest publication, From Strategy to Analysis: A Guide to Navigating Google Analytics, gives arts managers a potential solution. Drawing parallels to the scientific method, this paper gives a complete step-by-step process using a theoretical case study organization to illustrate how an arts manager can use Google Analytics to achieve their organizational goals.
#TBT: A Toolkit For Workflow Management
In most cases, an organization’s efficacy is only as strong as its internal cohesiveness. But how do we create this environment? There are many technological tools available that are designed to ease organizational communication and workflow management, and through the years AMT Lab has written product reviews and articles featuring several of them. This week’s TBT is a toolkit for managers thinking about implementing new communication or workflow processes, or even reviewing their existing processes to see whether they have the best tools for their projects.
#TBT: An Organizational Guide for Adjusting to New Technology
While many idealize the implementation of technology into organizational practices, those who have attempted to do so know firsthand that there are many challenges involved--many of which have less to do with the technology itself, and more to do with the human process of adjusting to it. Over the years, several AMT Lab articles have covered different aspects of this adjustment, and today’s throwback gathers them together to create a handy organizational guide to adjusting to technology.
#TBT: The Arts Manager's Toolkit for Data Management
Here at AMT Lab, we have been sorting through plenty of data as we prepare for tomorrow’s release of the full report from our 2015 National Ticketing Survey (stay tuned!). Today’s throwback is a collection of AMT Lab Articles that discuss tools, stories and best practices for the management and usage of quantitative data in an arts organization. Most of these are a more recent throwback, but even those articles from 2012 still provide invaluable resources for organizational leaders.
Present vs. Future Return on CRM Selection: Lessons from the Pallas Theatre Collective
When adopting a CRM system, especially as a young organization, it is often better to enter the process with a view that focuses less on the expectation of immediate business returns and more on making an investment in the future. Indeed, even the implementation of a user-friendly system like Artful.ly or PatronManager will likely involve significant staff-hours to clean data, transfer files, and train users. During a recent series of interviews conducted with nano-nonprofit administrators either on the verge or in the midst of CRM implementation, ensuring that this huge productivity drain is a one-time occurrence and not a recurring nightmare emerged as a common concern.
Research Update: From Simulcast Audience To Live Audience
San Francisco Opera's (SFO) general director David Gockley came to the company in 2006, bringing with him the legacy of free "plazacasts" that he had done at the Houston Grand Opera, his former home. During his first year at the San Francisco Opera, 8,000 people turned up at Civic Center Plaza near the Opera’s home at War Memorial Opera House to watch a simulcast of Puccini's Madama Butterfly. However, Gockley was concerned that there was no method of tracking the conversion of simulcast attendees to ticket buyers, so at the suggestion of a staff member, the simulcasts were moved to the AT&T ballpark.
Last Call! Tech Challenges in the Arts Management World
We'll be closing our audience poll this Monday, January 21. Now is the time for you and all of your arts-oriented colleagues to tell us what tech challenges you face on a regular basis. Then check back for results! [polldaddy poll=6814063]
Time of Transition
Does something seem different? Did we get a haircut? New pair of glasses? Start working out? Can’t quite put your finger on it?
Technology in the Arts recently embarked on the beginning of a yearlong journey to assess our role in the world of arts management and technology. Externally, you may notice changes to the look of our site as we continue to update our WordPress infrastructure. Internally, we are engaging in a strategic planning process to reposition and rebrand Technology in the Arts to better serve our audiences.
Part of that effort is to learn more about YOU. Throughout the coming months we will be polling our users to find out what challenges, triumphs, needs, and desires are lurking in the professional niches you inhabit. We invite you to participate, submit comments, and check back to see what we’re finding. What types of content would be most helpful to you? What questions do you have? What excites you? Where do you see arts management and technology intersecting? Where don’t you?
Transitions are afoot. Let’s begin!
[polldaddy poll=6814063]
Planning for When Things Fail
A recent article in Wired magazine by Robert Clapps focused on failure of things: helicopter parts to car tires. It is a good read and carries with it lessons. One of which is very important to the arts: failure can be costly and dangerous. Every physical thing in an arts organization from the stage lights to the copier machine to the building itself will eventually fail or need maintenance. As technology is frequently outdated, technological failures can happen through breakage but also through communication incompatibilities, discontinuation of support from the manufacturer or author, and through failure of a connected system that enables the technology. There are several different aspects to failure and avoiding additional loss when it happens, indeed many large corporations have entire departments dedicated to failure and maintenance analysis, risk assessment, loss mitigation, and analysis of these issues.
Whether you are looking at a minor failure causing inconvenience or a major failure that endangers lives it is incumbent upon arts managers to minimize risk proportionate to the danger to people, operations, and physical collateral. Most of the arts sector has a replace it as we go mentality with a budget for facilities and equipment maintenance and replacement. Some organizations also rely on insurance to mitigate against catastrophic equipment failures. There are sometimes even departmental or organizational plans and schedules.
If not present already, incorporation of a regular organization-wide facility, technology, and equipment assessment should be a high priority for organizations of any size. These assessments can then be used to accurately determine how much risk and what type of risk is present and how likely failure will be to happen. Risk assessment should be given a monetary value that reflects the type and severity of the nature of the potential failure and assigned proportionate weight in budgets. For instance, a technological failure resulting in a breach of network security can lead to personal information of patrons being compromised and not only effect the finances of your organization but also those of your patrons.
It is not enough to rely on a vendor to determine risk in many situations. Software companies of all sizes test for security but it is notable how often failures occur. Vendors are frequently the authors of software, the testers for the products, as well as the salespeople and support staff. As such it can be difficult to get an unvarnished assessment of the true strength of software from vendor.
To combat this you need to do your research. When reviewing any new or existing piece of technology, hardware or software it is wise to take a multi-format approach. Read reviews and talk to colleagues in both your field who are using the product but also those in the software field. Often times there are chat boards that can also offer illuminating insight as to the strength of software based on or interfacing with another piece of software (such as Apache for databases). Any system is only as strong as its weakest component and, at an application level, you will be looking at not only the strength of the application but also the operating system that it was written for, their age, and their compatibility with other applications (including operating system based security, application based security, and network security.)
Finding a balance between planning for the future and available money can be a challenge but on the other hand planning for the future can also save your organization money, heartache, and increase efficiency over time. Nonprofit Technology Network and Idealware both have resources and education for technology planning and can help get you started. If you have additional resources that you would like for your colleagues to be aware of, please post them in the comments!
Hype Cycle for Emerging Technologies: Distinguishing the Hype from the Viable
Making informed technology decisions means understanding the necessity, impact, and sustainability of the technology; the technology’s current and future relevance to the industry; and how it supports the organization’s business goals.
When new technologies make bold promises, how do you discern the hype from what’s commercially viable? And when will such claims pay off, if at all? Gartner Hype Cycles provide a graphic representation of the maturity and adoption of technologies and applications, and how they are potentially relevant to solving real business problems and exploiting new opportunities.
With new technologies emerging overnight, early adopters tweeting about them by your morning coffee, and six beta invites in your inbox by your evening commute, deciding which technologies will pay off, which are relevant and which will last, is by no means a simple project. Gartner, Inc., a leading information technology research and advisory company, produces Hype Cycles to help clients differentiate the “hype” technologies from the viable technologies. These graphics, organized by industry and aggregated in the “Hype Cycle for Emerging Technologies,” provide clients with insight to the risk, opportunity, and viability of various technologies in specific industries.
"Hype Cycle for Emerging Technologies" targets strategic planning, innovation and emerging technology professionals by highlighting a set of technologies that will have broad-ranging impact across the business. It is the broadest aggregate Gartner Hype Cycle, featuring technologies that are the focus of attention because of particularly high levels of hype, or those that may not be broadly acknowledged but that Gartner believes have the potential for significant impact.-- Jackie Fenn, vice president and Gartner fellow, August 2011 Gartner press release
In the Hype Cycle, a technology’s life has five phases. These phases are (as defined by Garnter,Inc.):
Technology Trigger: A potential technology breakthrough kicks things off. Early proof-of-concept stories and media interest trigger significant publicity. Often no usable products exist and commercial viability is unproven.
Peak of Inflated Expectations: Early publicity produces a number of success stories—often accompanied by scores of failures. Some companies take action; many do not.
Trough of Disillusionment: Interest wanes as experiments and implementations fail to deliver. Producers of the technology shake out or fail. Investments continue only if the surviving providers improve their products to the satisfaction of early adopters.
Slope of Enlightenment: More instances of how the technology can benefit the enterprise start to crystallize and become more widely understood. Second- and third-generation products appear from technology providers. More enterprises fund pilots; conservative companies remain cautious.
Plateau of Productivity: Mainstream adoption starts to take off. Criteria for assessing provider viability are more clearly defined. The technology’s broad market applicability and relevance are clearly paying off.
Many Gartner clients use Hype Cycles as part of their technology-planning process, often drawing from multiple Hype Cycles, augmented with industry- or company-specific topics to create their own Hype Cycles and Priority Matrices. Technology providers use Hype Cycles as a way to understand the likely market reaction to their products and services based on the adopter community's expectations and attitudes. Investors watch for technologies that are on the rise in a Hype Cycle to try to catch them before the Peak of Inflated Expectations or at the beginning of the Slope of Enlightenment before they move into mainstream adoption. –Jackie Fenn
Gartner’s complete reports on technology trends and in-depth analyses of the Hype Cycles can be purchased online. But for now, take a look at the Hype Cycle for Emerging Technologies (as of July 2011):
To our followers across various industries--does or will this foresight affect your technology-planning strategy?
Are Bricks and Mortar the Best Use for Money in the Arts? The Overbuild of Cultural Facilities in the United States
Recently, the University of Chicago’s Cultural Policy Center released the report, “Set in Stone: Building America’s New Generation of Arts Facilities, 1994-2008.”
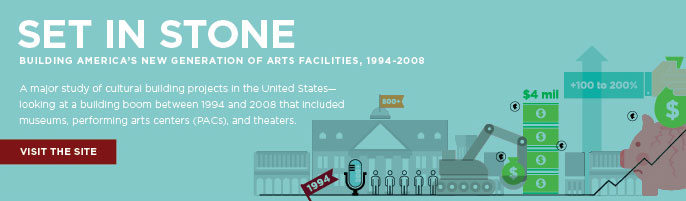
Summary: The research examines the boom of major cultural building projects (museum, performing arts centers, and theaters) between 1998 and 2004, specifically looking at the decade between 1990 and 2000. The findings indicate during that period, “the level of investment in bricks and mortar as a percentage of total revenue and assets was disproportionate.” The full report addresses the landscape of cultural building, the investment determinants of cultural building, the feasibility of cultural building projects, and the effects on communities. The report takes into account population change, the national trend in ratio of arts organizations to cultural facilities, the relationship between the number of existing facilities in an MSA and the population, GDP, economic climate, municipal spending on physical infrastructure, spending by type of project, education rates, median household income levels, distribution of costs of projects (by region), geographic considerations, and other factors affecting the supply, demand and sustainability of cultural building projects.
[embed]http://youtu.be/KwhG7SK9csc[/embed]
Case Studies: Four case studies, presented as teaching resources, portray complex, management situations students and professionals might encounter in the real world. The cases (comprised using internal documents , construction data, and first-hand accounts from administrators, board members and/or volunteers involved in each situation) emphasize the need for managers to make strategic decisions, weighing the benefits and risks of each potential course of action. These studies provide a platform for discussion about the strategic design of projects, potentially shaping future design and management practice.
The four case studies highlight issues of strategic decision making, project design, expansion and management at:
1) the Art Institute of Chicago in Chicago, IL
2) the AT&T Performing Arts Center in Dallas, TX
3) the Long Center for the Performing Arts in Austin, TX
4) the Taubman Museum of Art in Roanoke, VA
Key Findings: The report and the findings show that (taken from the report)
- Cultural institutions and arts facilities were overbuilt during the boom years
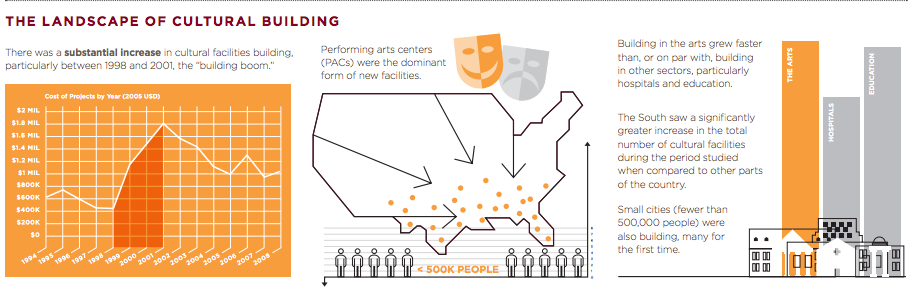
- Performing Arts Centers were the dominant form of new facilities
- The building boom affected the entire country, but was concentrated in the South, which saw enormous increases in the total number of facilities
- Building in the arts grew faster between 1998 and 2001 than or on par with building in other sectors, particularly health and education
- Rising population and higher average levels of education and income help explain why some cities built more than others
- There is no clear pattern of spillover effects (negative or positive) of specific cultural building projects on non-building local cultural organizations and the greater community
- There was far less investment in traditional theater facilities than there was in museum and performing arts centers
- The New York-Northern New Jersey-Long Island MSA spent more on cultural infrastructure ($1.6 billion) building than any other MSA during this period
- Research shows that for every additional cultural facility a city had, it invested between $0.11 and $0.23 more per capita per year in cultural building projects
- What influenced how much a city invested in cultural infrastructure was not the size of a city’s population, but how fast the population was increasing or decreasing
[embed]http://youtu.be/76vN7mb9n6E[/embed]
Looking Ahead: Joana Woronkowicz, co-author of the report, summarizes the lessons learned from the study and how the arts industry should proceed in making building project decisions.
• What is the motivation for the project?
• Does it align with organization’s artistic mission?
• Is there a need for the project (not a want), but a need?
• Do I have the leadership in place to take the project from the beginning to the end?
• Does the building project respond to the needs of the community?
• How can I be flexible in controlling expenses and nimble in generating income?
Americans are paying more for culture, opportunity looms on the technology front
New information out from the Consumer Price Index (CPI) indicate that Americans are spending more for both technology and entertainment (a catagory that includes cultural expenditures). How can cultural organizations capitalize on this? What does this mean? Articles in both The Atlantic and NPR's Planet Money look at these trends from a more general standpoint but don't drill down on the idea for the arts. The facts presented from the Atlantic indicate that 2007 Recreation expenditures are up by 1.7% over those from the US in 1947. The NPR article states that as a percentage of household income, expenditures on Entertainment rose from 5% of the total in 1947 to 6% in 2007. This information along with the more current information from the CPI which had the Recreation Index gaining by .6% (driven in part by a 1.2% and 2.0% rise in admission to cultural events in Dec 2011 and Jan 2012) this last January give the arts sector some reason to look favorably towards the horizon. These numbers mean recovery, and recovery means opportunity for change. The relative gains in the arts sector are paltry compared to the gains made on technology purchases in the same amount of time. The number of personal computers in homes (worldwide), for instance, grew from 152 Million from 1993 to 2002. The number of internet users in that same time frame went from 10.5 million to 716 million. The growth of other tech is no less startling by most accounts. The synthesis of the growth of technology has yet to be fully realized by the arts sector at large but this brief respite (where revenue is rebounding from recession) should be a moment where we rally to adapt.
What do these broad economic indicators mean? Consumer confidence has been slowly recovering since the doldrums that it was in around 2008 and 2009. As budgets start to recover and earned income from ticket and admission sales start to edge up, arts leaders will be faced with decisions about what to do with the money. The temptation to return departments and programs to the pre-recession status quo will be strong; the opportunity, however, for transformation through technology to meet the larger changes in how people are consuming arts and culture should be the priority.
As many technologies are currently moving out of first generation and subsequently becoming less expensive the opportunity to develop interfacing content for them is also becoming less expensive. Application development for mobile devices is, for instance, now within the fiscal reach of the arts sector. Similarly simulcast capabilities in HD are coming into broader usage in peforming arts organizations across the country. The time to identify and implement new technology is now.