


Source: Idealware.org
Contributors Aoni Wang and Giorgia Gandolfini recently attended Idealware’s webinar, Infographics for Outreach, Advocacy, and Marketing: From Data to Design . This talk delved deeply into strategies for successful design of infographics. The webinar is available on-demand from Idealware for a modest charge of $20, along with lectures on a slew of other useful topics.
An infographic is an image that presents data, transferring numbers into a comprehensive visual narrative. Infographics have become very popular among organizations, as they are generally easier to understand and more effective at communicating data to the population at-large than traditional spreadsheets and reports. Infographics attract attention and provide new ways for visitors to engage with data. Five dimensions can be used to help analyze an infographic: shareability, digestibility, interest (whether it speaks to the mind or to the heart), appeal, and depth of content.
Recording can be accessed here http://www.idealware.org/online-seminars/recording-infographics-outreach-advocacy-and-marketing-data-design
Successful infographic creation requires a few key preliminary steps:
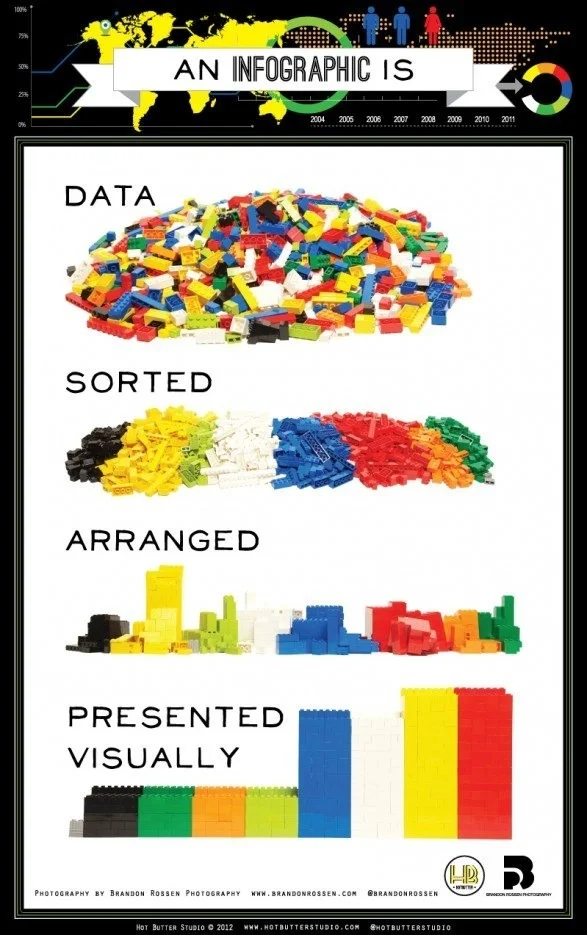
An infographic on infographics from Mashable
1 Define goals – although infographics are excellent at making large amounts of data more comprehensible, good infographics seek to leave viewers with clear takeaways.
2 Know the audience – understanding what audience members want to see and how they might respond to an infographic’s message can aid in its construction.
3 Consider platform – infographic design must be compatible with its intended distribution channel. For example, a three-page vertical infographic would be a poor fit for Facebook, as the website would compress the size of the image and few viewers would bother to look closer.
As for creating the final result, organizations have several options. While choosing a professional designer is usually preferable, when concepts are simple and resources such as Excel, PowerPoint, Adobe Creative Suite and other similar tools are available, D.I.Y. may be an option. Even when a professional designer is hired for the project, the active involvement of organizational stakeholders can ensure ideas are conveyed correctly and effectively.
Infographics are a fun and accessible communication tool, with many applications for arts organizations. Whether using infographics for marketing, education, or development, organizations need not worry too much about whether an image is “good” or “bad”. As long as the infographic clearly serves the organization’s objectives, conveys accurate information and can be easily understood by its target audience, it is a success. Here is one last example of an infographic, presenting NEA and Census data.

An arts infographic from Good Magazine